| |
 |
-
Group Revenue up 5% to $224.8 million
- 15 new stores opened in 3 countries
- Trial of 4 stores commences in Canada
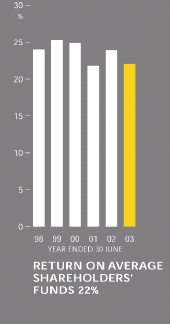
- 22% return on average Shareholders funds
- Dividend for year maintained at 17 cents per share plus special dividend of 20 cents per share paid in October 2002
- Group consolidates structure for future growth
|
| YEAR ENDED 30 JUNE, NZ$000’s UNLESS STATED |
|
2003
|
2002
|
% change
|
|
| TRADING RESULTS |
|
|
|
|
| • Group revenue |
|
224,802
|
214,105
|
+5.0%
|
| • Earnings before interest and tax |
|
|
|
|
| and unallocated expenses (before abnormals) |
|
21,219
|
23,013
|
-7.8%
|
| • Group surplus after tax (before abnormals) |
|
10,244
|
12,298
|
-16.7%
|
| - First half |
|
7,525
|
8,712
|
-13.6%
|
| - Second half |
|
2,719
|
3,586
|
-24.2%
|
| • Group surplus after tax (after abnormals) |
|
11,570
|
12,706
|
-8.9%
|
| • Net cash from operating activities |
|
6,789
|
8,871
|
-23.5%
|
| FINANCIAL POSITION AT 1YEAR END |
|
|
|
|
| • Issued and paid up capital, 38,558,600 ordinary shares |
|
7,712
|
7,712
|
|
| • Total shareholders’ funds |
|
50,048
|
53,328
|
-6.2%
|
| • Total assets |
|
109,228
|
96,413
|
+13.3%
|
| • Net debt |
|
40,177
|
27,454
|
+46.3%
|
| • Capital expenditure - cash |
|
10,313
|
6,256
|
+64.8%
|
|
| NUMBER OF STORES 30 JUNE |
|
|
|
|
| • New Zealand |
|
46
|
43
|
|
| • Australia |
|
84
|
77
|
|
| • Canada |
|
4
|
-
|
|
| Total |
|
134
|
120
|
|
|
| DISTRIBUTION TO SHAREHOLDERS |
|
|
|
|
| • Dividends - including final dividend |
|
|
|
|
| - Per ordinary share |
|
17.0¢
|
17.0¢
|
|
| - Times covered by surplus after tax |
|
1.77
|
1.9
|
|
| • Special Dividend - paid 14 October 2002 |
|
20.0¢
|
-
|
|
|
| SHARE PRICE |
|
|
|
|
| 30 June |
|
$4.60
|
$5.00
|
|
|
| KEY DATA PER SHARE |
|
|
|
|
| • Earnings before abnormal items |
|
26.6¢
|
31.9¢
|
|
| • Earnings after abnormal items |
|
30.0¢
|
32.95¢
|
|
|
| KEY MEASURES |
|
|
|
|
| • Same store sales up |
|
|
|
|
| - Australia |
|
5.7%
|
6.4%
|
|
| - New Zealand |
|
1.0%
|
13.0%
|
|
| • Return on average shareholders’ funds |
|
22%
|
23.9%
|
|
| • Interest cover (times) |
|
7.2
|
10.3
|
|
| • Equity Ratio |
|
45.8%
|
55%
|
|
| • Current ratio |
|
5.4:1
|
5.6:1
|
|
|
|
|
 |
|

